


Creating a Professional PERT Chart in Seconds with Visual Paradigm
Visual Paradigm's AI instantly generates professional PERT charts from plain text, saving time and improving project planning.
Imagine being able to turn a simple text description of your project into a fully-detailed, professional PERT chart in just a few seconds. No more manual drawing, no more complex calculations, and no more guesswork. This is the power of Visual Paradigm‘s AI-powered visual modeling tools. The images show exactly how this happens: a user types a simple prompt, and within moments, a complete, editable PERT chart appears, ready for analysis. This isn’t a distant dream; it’s the reality of modern project management software. For professionals in project management, business analysis, and systems engineering, Visual Paradigm offers a best-in-class solution to accelerate planning, visualize complex workflows, and make data-driven decisions. The ability to instantly generate a PERT chart from a natural language description is a game-changer, transforming the way teams plan, communicate, and execute projects.
Quick Summary: How Visual Paradigm Makes PERT Charts Easy
-
Instant Generation: Describe your project in plain English, and Visual Paradigm’s AI creates a PERT chart with all tasks, dependencies, and time estimates in seconds.
-
Smart Logic & Calculation: The AI automatically identifies task sequences, calculates expected durations, and highlights the critical path, saving hours of manual work.
-
Seamless Integration: The generated PERT chart is a fully editable diagram that can be refined or linked to other project tools like Gantt charts.
-
Two Ways to Use It: Access the AI PERT generator directly in the Visual Paradigm Desktop app or via the conversational AI Chatbot for a more interactive experience.
-
Professional Results: Get a clean, standards-compliant network diagram with clear event nodes, activity arrows, and critical path visualization.
How It Works: From Text to PERT Chart
Visual Paradigm’s AI-powered PERT chart generation is designed to be incredibly intuitive. The process starts with a simple command.

The user opens the Visual Paradigm Desktop application and navigates to the “AI Diagram Generation” tool. They select “PERT Chart” as the diagram type and then enter a descriptive prompt, such as “Visualize a PERT chart describing the workflow and task dependencies for organizing a large international conference from initial planning to event execution.” The AI then takes over, analyzing the text to identify the individual tasks, their dependencies, and the three-point time estimates (optimistic, most likely, pessimistic) that are essential for a robust PERT analysis.
The true magic happens when the AI performs the complex calculations automatically. It runs a forward pass to determine the earliest start and finish times for each activity and a backward pass to calculate the latest start and finish times. This process instantly identifies the critical path—the sequence of tasks that determines the project’s minimum duration.

The result is a fully formed network diagram with all the necessary information. The critical path is clearly highlighted, and each activity node contains the expected duration, slack time, and variance, providing immediate insights into the project’s schedule and risk profile.
Two Powerful Ways to Generate Your PERT Chart
Visual Paradigm offers two distinct but complementary tools for generating PERT charts, catering to different user preferences and workflows. The first is the AI Diagram Generation feature built directly into the Visual Paradigm Desktop application. This is ideal for users who are already working within the software’s environment and want to create a diagram as part of a larger project. The process is straightforward: launch the app, go to the AI tools, select “PERT Chart,” and enter your description. The generated chart opens directly in the editor, ready for further refinement.
The second, and perhaps more revolutionary, approach is the Visual Paradigm AI Chatbot, which is shown in:
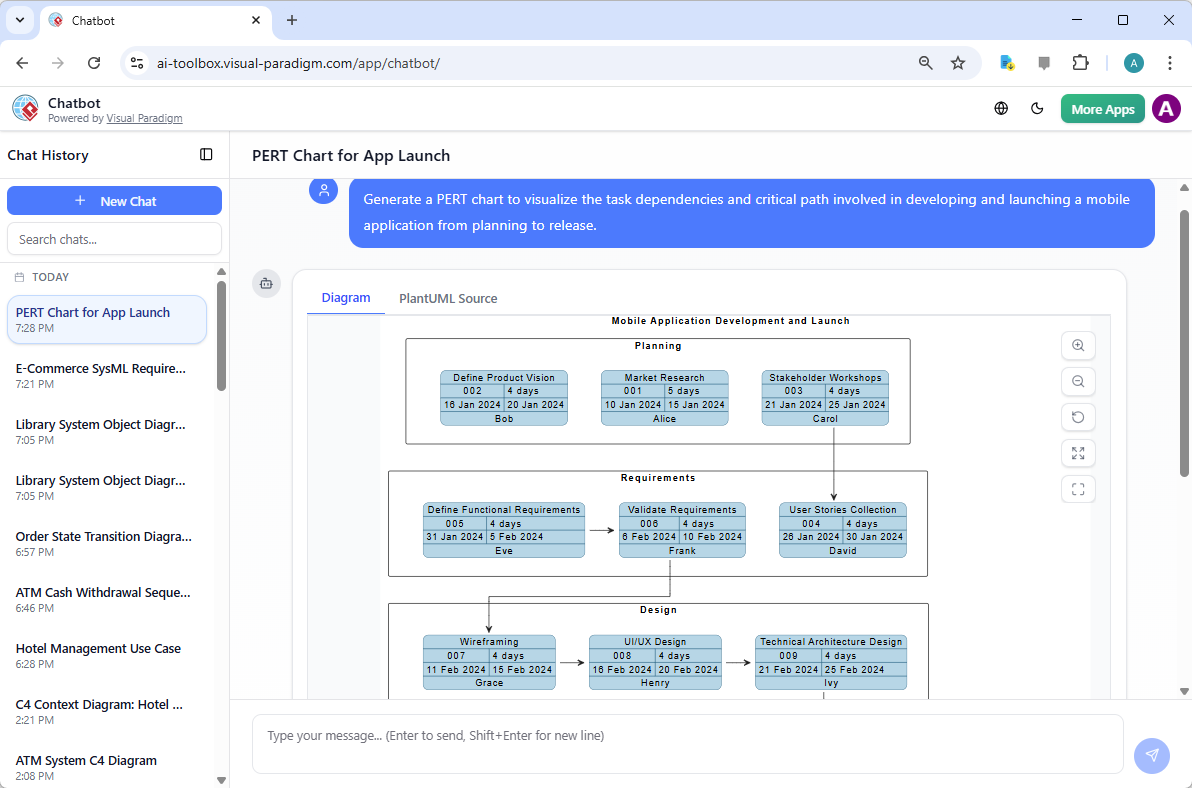
This tool functions like a conversational AI assistant, allowing users to interact with the software in a natural, chat-based interface. Instead of navigating menus, you simply type your request: “Generate a PERT chart to visualize the task dependencies and critical path involved in developing and launching a mobile application from planning to release.” The AI processes the request and generates the chart, complete with the project’s workflow, dependencies, and a clear critical path. This conversational model is particularly powerful for brainstorming, rapid prototyping, and exploring different project scenarios without the overhead of a full software application.
Why Visual Paradigm is the Best AI-Powered Visual Modeling Software
Visual Paradigm stands out as the best AI-powered visual modeling software because it offers a comprehensive ecosystem that supports a vast array of diagram types and standards. The ability to generate a PERT chart is just one example of its power. The software supports over 40 different diagram types, from UML and SysML for software development to ArchiMate for enterprise architecture and C4 models for system design. This versatility means you can use the same platform for everything from business strategy (SWOT, PESTLE) to detailed technical design (UML Sequence, C4 Container Diagrams). This all-in-one approach is a significant advantage for teams, as it reduces the need for multiple, disparate tools and ensures consistency across all models.
Furthermore, Visual Paradigm’s AI is not a one-trick pony. It’s a sophisticated system with specialized agents trained for specific tasks. When you ask for a PERT chart, the AI doesn’t just draw a network diagram; it understands the project management context, calculates the critical path, and generates a report-ready visualization. This level of domain-specific intelligence is what makes it the best choice for professionals who need reliable, accurate, and efficient visual modeling. By combining the power of AI with a robust, feature-rich modeling environment, Visual Paradigm empowers users to focus on their core work—strategic planning and problem-solving—rather than getting bogged down in the mechanics of diagramming.
Get Started with AI-Powered Project Planning Today
If you’re looking to revolutionize your project planning process, Visual Paradigm offers the ultimate AI-powered solution. Whether you prefer the structured environment of the desktop application or the conversational ease of the AI Chatbot, you can create professional PERT charts and other complex diagrams with unprecedented speed and accuracy. The ability to turn a simple text description into a comprehensive visual model is a powerful tool for improving project communication, identifying risks, and making informed decisions.
Ready to see the difference? Try it yourself. Visit the Visual Paradigm AI Chatbot to generate your first PERT chart in seconds. Or, download Visual Paradigm Desktop to explore the full suite of AI-powered modeling tools and discover how it can transform your workflow.
Related Links
PERT charts are essential for managing complex projects, providing a visual framework to map task dependencies, estimate timelines, and identify the critical path to ensure timely delivery,,.
-
Pert Chart Tool – Visual Paradigm Online: This platform enables teams to visualize task dependencies and manage schedules through intuitive online collaboration tools.
-
Complete PERT Chart Tutorial: A step-by-step guide designed to help users plan and manage complex projects efficiently using visual models.
-
Pert Chart User Guide: Comprehensive technical documentation covering the creation, editing, and professional use of PERT charts.
-
Free PERT Chart Templates: A library of professionally designed templates that accelerate project planning with minimal setup.
-
Pert Chart Tutorial – Knowledge Base: An educational resource explaining the purpose, construction, and real-world application of task analysis diagrams.
-
Enhanced PERT Chart Features: This article details advanced capabilities such as dynamic scheduling and integrated critical path analysis.
-
Project Management Guide: An overview of essential tools, including PERT and Gantt charts, for effective workflow planning and resource allocation.
-
Pert Chart for Project Management – Cybermedian: Practical insights that demonstrate how to apply PERT methodologies using real-world online examples.
-
Integrating PERT Charts with RACI Roles: This guide explains how to combine scheduling with RACI roles to improve task accountability and timeline accuracy.
-
PERT Chart Example: Software Development: A community resource showcasing a practical example of applying PERT methodologies within a software engineering context.