


Visualizing Solar Energy Steps with AI Infographic Generator
Transform complex solar energy steps into stunning diagrams using Visual Paradigm's AI Infographic Generator. Perfect for marketers and professionals.
Are you looking for the simplest way to turn complex ideas into beautiful visuals? Creating a professional graphic can often feel overwhelming, but with the right AI Infographic Generator, anyone can do it. Visual Paradigm has developed an innovative tool that handles the hard work for you, allowing you to focus on your message rather than struggling with complex design software. In this guide, we will walk you through exactly how to create a stunning process diagram, using a solar energy workflow as our example.
The AI Infographic Generator by Visual Paradigm is a revolutionary application that transforms your text prompts into structured, visually appealing data. It is specifically designed for people who may not have a background in graphic design but need to communicate information effectively. Whether you are a marketer, a teacher, or a business professional, this tool provides a supportive and gentle way to produce high-quality assets in just a few minutes. By simply describing your topic, the artificial intelligence generates the content, selects icons, and arranges everything into a polished template.
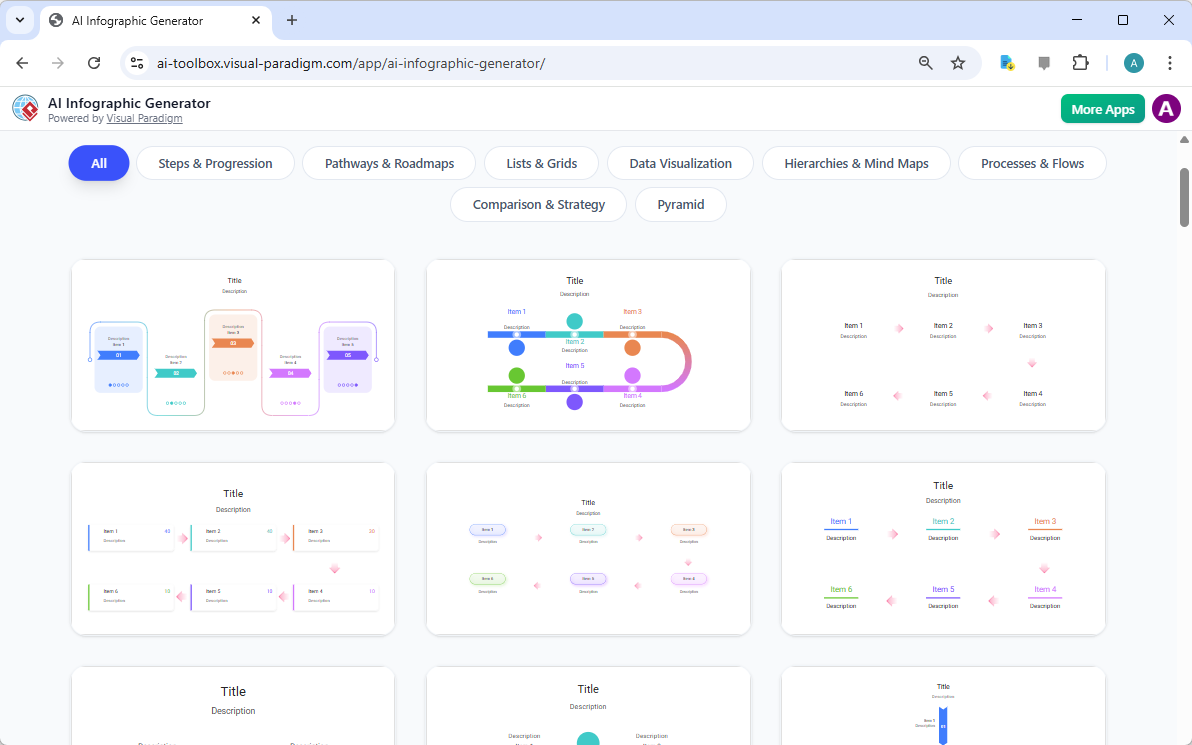
When you first open the tool, you are greeted by a clean and organized Template Gallery. This is your starting point, where you can see many different styles ranging from simple lists to complex roadmaps. Each template is professionally designed to ensure your final product looks cohesive and elegant. You do not have to worry about picking the “wrong” one, as they are all built to be flexible and easy to read. This variety ensures that no matter what your topic is, there is a layout that will make your information shine.
Key Takeaways for Rapid Content Creation
-
Effortless Design: No prior design experience is required to create professional-grade visuals.
-
Time-Saving AI: The best AI infographic generator researches and structures your data in seconds.
-
Flexible Customization: Easily adjust the number of points and touch up text for a perfect finish.
-
High-Quality Output: Export your work as scalable SVG files for crisp printing or web use.
-
User-Friendly Interface: A simple sidebar-to-stage workflow keeps the process calm and focused.
Step 1: Launch the Editor and Set Your Topic
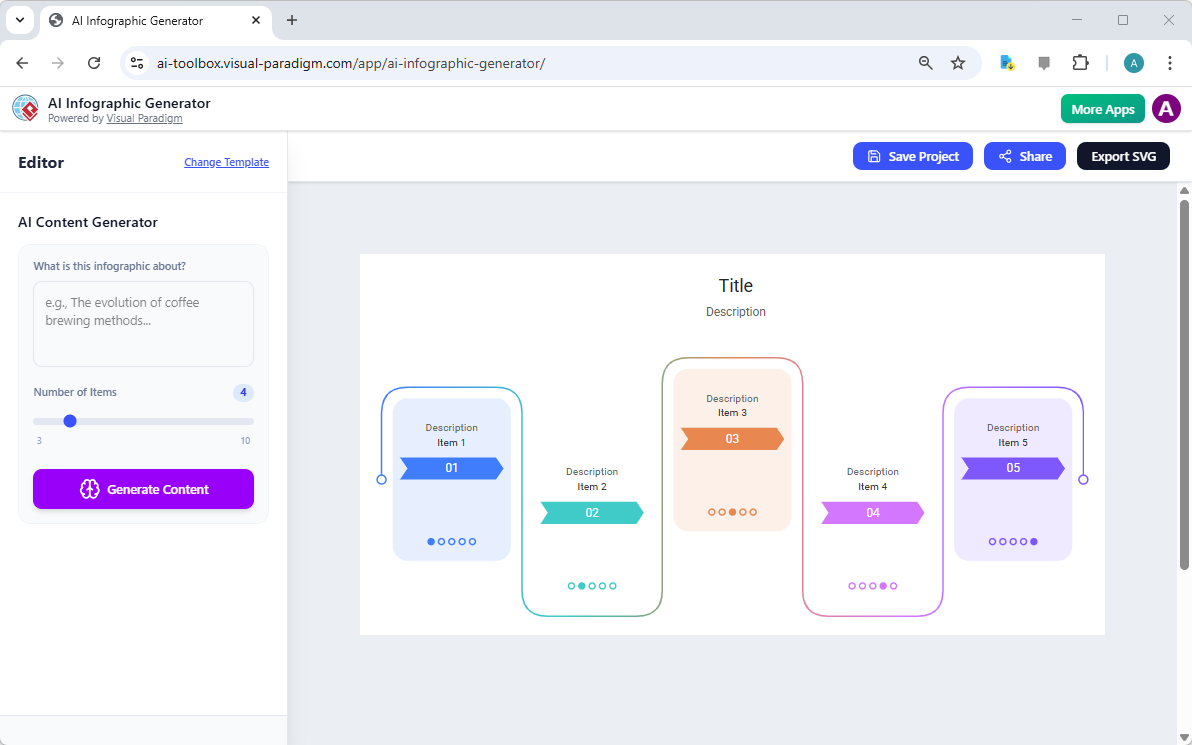
Once you have selected a style that you like, the application will take you into the Editor page. This workspace is designed to be very straightforward. On the left side, you will find the input pane where you talk to the AI, and on the right side, you see a large preview of your infographic. It feels very safe and organized, giving you a clear view of your project as it develops. This layout ensures that you always know exactly where you are in the creation process.
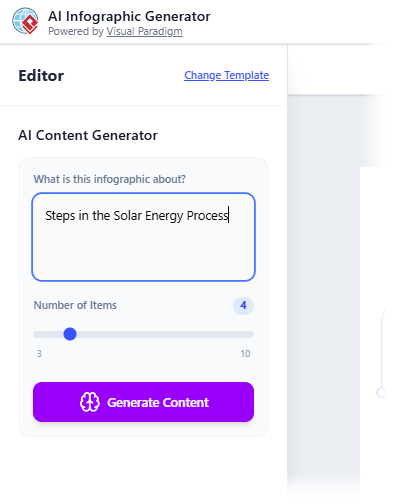
Now, it is time to give the AI its instructions. This is done through a “Prompt.” A prompt is simply a clear description of what you want your infographic to be about. In our example, we want to explain how solar energy works. By typing a clear, simple phrase into the prompt field, you are giving the AI the foundation it needs to build your visual story. It is a very magical experience to see a single sentence turn into a full set of data points.
Step 2: Fine-Tuning the AI Generation
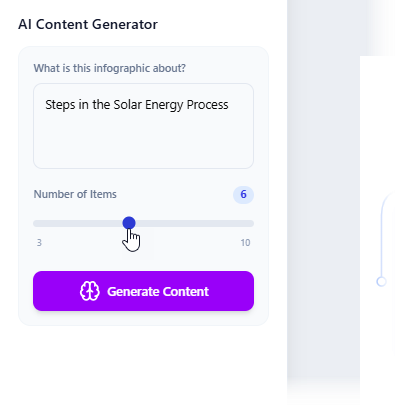
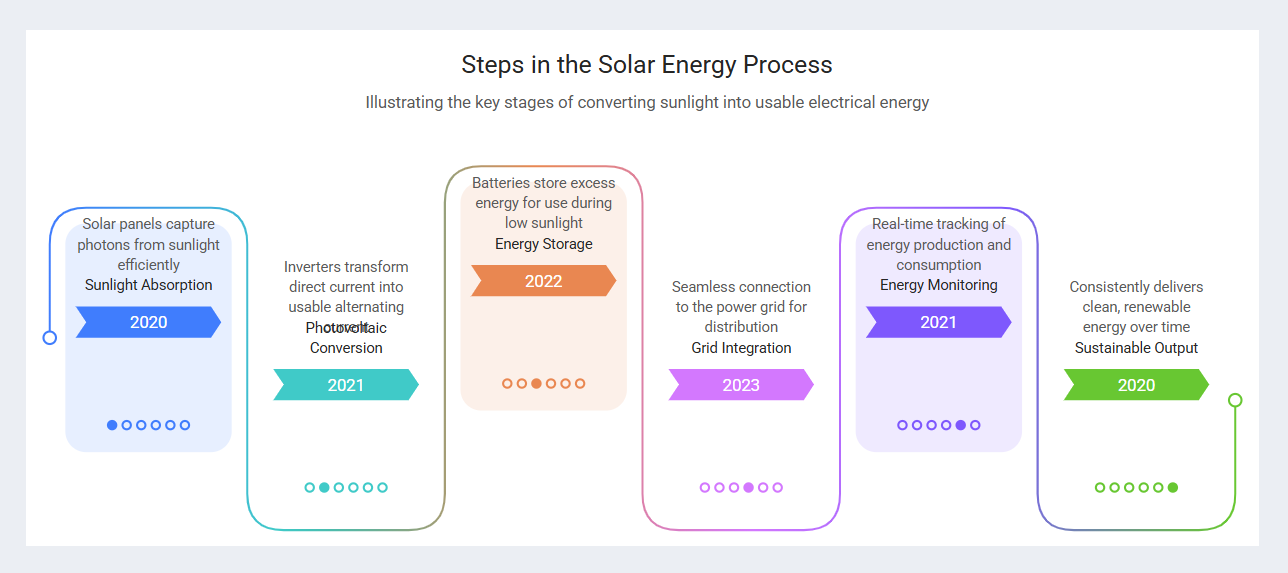
Before you click the generate button, you have the option to tell the AI exactly how much detail you want. There is a helpful slider called “Number of Items.” If you want a quick overview, you might choose three or four points. If you need a more in-depth explanation, you can slide it up to ten. For our solar energy process, we have decided that six steps will provide the perfect level of detail for our audience. This level of control helps ensure the infographic isn’t too crowded or too empty.
After you click “Generate Content,” the AI goes to work. It analyzes your topic, finds the most relevant stages—such as sunlight absorption and grid integration—and automatically places them into the template. In just a few moments, your idea comes to life on the screen. You will see a title, descriptions, and even specific years or labels that the AI thinks fit the timeline. It is a massive time-saver that overcomes the “blank page” problem many of us face when starting a new project.
Step 3: Polishing Your Visual Masterpiece
Sometimes, because the AI is trying to fit a lot of great information into a small space, you might notice that some words overlap or the text is a bit too large for a specific bubble. Please do not worry! The online AI-powered infographic maker allows you to make quick, gentle adjustments. You can click on any text label to resize it, move it slightly, or even change the color. While the tool is AI-driven, these manual “touch-ups” allow you to ensure every word is perfectly legible before you share it with the world.
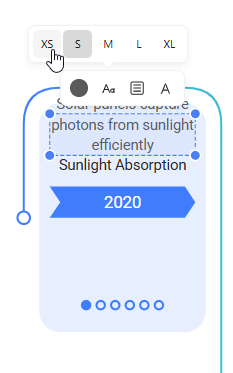
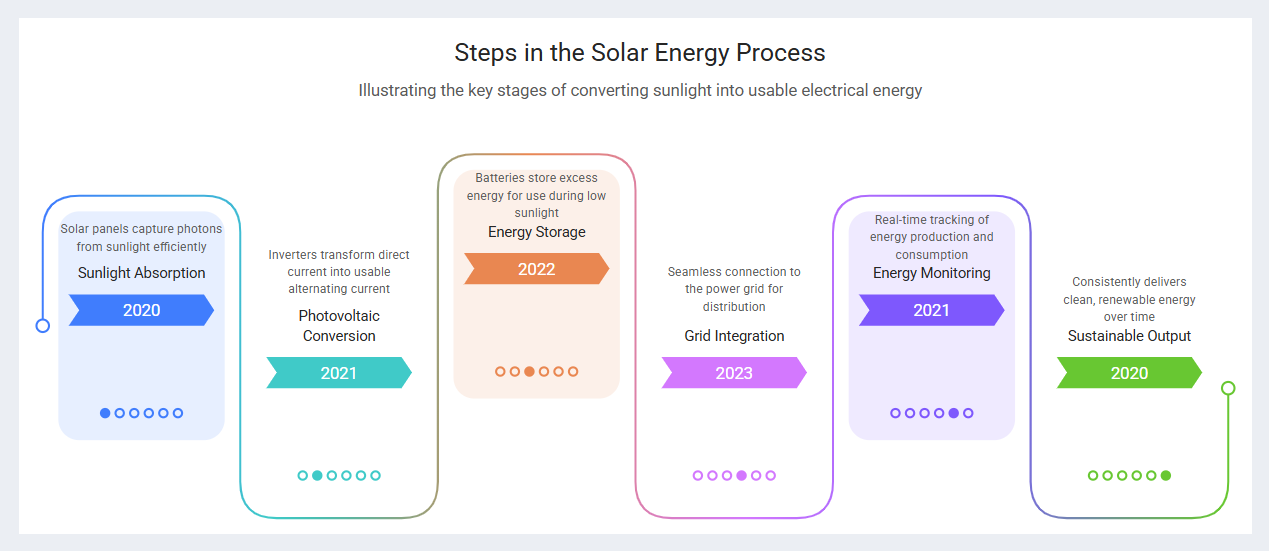
The ability to resize text labels, such as changing them from “Medium” to “Extra Small,” is incredibly helpful for maintaining a clean look. You can also edit the text directly if you want to add a specific fact or change a word to better suit your brand’s voice. These changes are reflected immediately in your preview, giving you instant feedback. Once you are happy with how everything looks, you can see your finished infographic in all its glory. It is a professional, high-quality asset that you created in just a fraction of the time it would take to do manually.
The Benefits of Using a Professional AI Design Tool
Using an easy-to-use infographic software like this one from Visual Paradigm offers several important benefits. First, it ensures brand consistency. Because you start with a professionally designed template, the colors and fonts are already chosen to look good together. Second, it simplifies data visualization. The AI intelligently decides how to present each piece of information so that it is easy for your audience to understand at a glance.
Finally, the export options are designed for professional use. You can export your finished work as an SVG (Scalable Vector Graphic). This is a very high-quality file format that stays sharp even if you make it very large for a poster or a presentation. You can also generate a unique shareable URL with a single click, making it very simple to send your work to colleagues or clients without having to deal with large email attachments. This tool truly makes communication more impactful and accessible for everyone.
Common Questions About the Generator
Many users wonder if they can change the topic after they have started. Yes, you can! You simply modify the prompt in the sidebar and click generate again. The AI will replace the old information with new data based on your updated request. Another common question is about the accuracy of the data. While the AI is very smart and uses a vast knowledge base, we always recommend a quick review of the text to ensure it matches your specific needs. This keeps you in total control of the final message.
The AI Infographic Generator is a powerful partner in your creative journey. It takes the stress out of design and allows you to be the expert communicator you were meant to be. By following these simple steps, you can turn any idea—from solar energy to marketing trends—into a visual masterpiece that captures attention and informs your audience with ease.
Start Creating Your Own Infographics Today
If you are ready to experience the magic of AI-driven design, there is no better time to start. Visual Paradigm has made this AI Infographic Generator available to help you communicate with impact and confidence. You don’t need to be a designer to create something beautiful; you just need a great idea and the right tool to bring it to life.
To begin your project, simply follow the link below to launch the app. Choose a template, enter your topic, and let the AI do the rest. We are excited to see the amazing visuals you will create!
Try the AI Infographic Generator now: Launch the AI Infographic Generator
Learn more about the tool’s features: Visit the Official Information Page
Related Links
Infographic makers provide intuitive, often AI-powered platforms for transforming complex data into visually compelling narratives through drag-and-drop tools, professional templates, and automated design suggestions. These solutions enable teams to enhance visual communication and storytelling without requiring extensive design expertise.
-
Free Infographic Maker – Create Professional Infographics Online: This web-based tool allows users to design informative and visually appealing infographics without any prior design experience.
-
InfoArt – All-in-One Infographic Design Platform: A comprehensive solution for creating, sharing, and publishing professional infographics using intuitive drag-and-drop functionality.
-
Step-by-Step Guide to Creating Infographics with Visual Paradigm Online: A detailed guide that walks users through the process of designing effective visuals using a user-friendly interface.
-
AI-Powered Visual Tools for Creating Infographics, Charts, and Graphics: This article explores how artificial intelligence accelerates the design process by providing intelligent suggestions and automation.
-
Visual Paradigm Online: Create Stunning Infographics and Diagrams: An overview highlighting the platform’s versatility in producing both professional infographics and complex technical models.
-
Infographic Templates – Ready-to-Use Designs for Quick Creation: A library of professionally designed templates categorized by industry and use case to speed up the content creation process.
-
Best Infographic Design Tools – Compare Features & Benefits: A resource for comparing top design tools to help users identify the best software for their specific data visualization needs.
-
AI-Powered 3-Aspect Infographic Designer Tool: This release focuses on an AI tool that enhances design efficiency by utilizing three intelligent dimensions for instant generation.
-
Five Key Elements of Designing an Effective Infographic: A guide that identifies the essential components required to create engaging and informative visual data presentations.
-
InfoChart – Create Informative Charts and Infographics Easily: A specialized tool designed for creating clear, data-driven visuals and engaging infocharts for reports and presentations.