


Visualize Product Competencies Fast: The Ultimate AI Radar Chart Maker by Visual Paradigm
Transform raw data into professional radar charts with Visual Paradigm's AI. Compare product metrics and team performance instantly via chat.
Stop wasting hours manually plotting axes and connecting data points for your competitive analysis. In today’s high-speed business environment, the AI Radar Chart Maker within the Visual Paradigm ecosystem is the game-changer you actually need. Whether you are comparing smartphone specs or evaluating team performance, this tool transforms raw text descriptions into professional, multi-dimensional visuals in seconds. Visual Paradigm has effectively democratized complex data visualization, allowing you to focus on high-level strategy rather than wrestling with annoying design software. If you want to see exactly how Visual Paradigm turns a simple chat message into a sophisticated spider chart, you’re in the right place. 🔥
Key Takeaways for High-Performance Teams
-
Conversational Diagramming: Generate complex radar charts just by chatting with an intelligent assistant.
-
Professional Comparison: Easily visualize strengths and weaknesses across multiple entities like products or employees.
-
Seamless Workflow: Move from the AI Chatbot to the Visual Paradigm Desktop for deep, formal modeling.
-
40+ Diagram Types: Beyond radar charts, access UML, SysML, C4, and ArchiMate with AI acceleration.
-
Instant Export: Get high-resolution PNGs or SVGs ready for your next big presentation or report.
Mastering the Visual Paradigm AI Chatbot for Instant Insights
The Visual Paradigm AI Chatbot is a specialized, conversational interface designed to act as your personal business analyst. By leveraging advanced specialized AI agents, the chatbot understands natural language prompts and renders interactive visuals directly in the chat window. Look at how it handles a request for product performance metrics; it doesn’t just give you a list of numbers, it builds a multi-axis polygonal chart that highlights exactly where a product excels and where it fails. This is the definition of efficiency for modern consultants and managers who need results now.
The interface is incredibly straightforward—no complex syntax or hidden menus. You just type something like “Create a Radar Chart representing performance metrics including quality, usability, reliability, efficiency, and customer satisfaction.” The AI recognizes the intent, engages the correct rendering agent, and produces a balanced, presentation-ready visual. It’s built for those who value their time and need to accelerate productivity without sacrificing clarity. Check out the clean output generated in the chat session below.

Why the AI Chatbot is a Pro’s Best Friend
One of the sickest features here is Session Sharing. Once the AI generates your radar chart, you can create a unique link to show your stakeholders exactly what the analysis looks like. It’s a total flex for remote collaboration. Plus, because the chatbot supports ArchiMate (with 20+ viewpoints), UML, and various strategy frameworks like SWOT and PESTLE, it’s not just a one-trick pony. It’s an all-in-one AI-powered visual modeling hub that lives in your browser but carries the weight of a full-scale enterprise tool. 🚀
Advanced Comparative Analysis in Visual Paradigm Desktop
While the chatbot is perfect for rapid-fire brainstorming, the Visual Paradigm Desktop application takes things to a professional level with its dedicated AI Diagram Generation window. This is where you go when you need to perform deep-dive comparative analysis, like benchmarking different smartphone models against specific technical criteria. The desktop tool utilizes a more robust engine to handle detailed descriptions, ensuring that every axis (or spoke) is perfectly scaled and every data series is clearly distinguished.
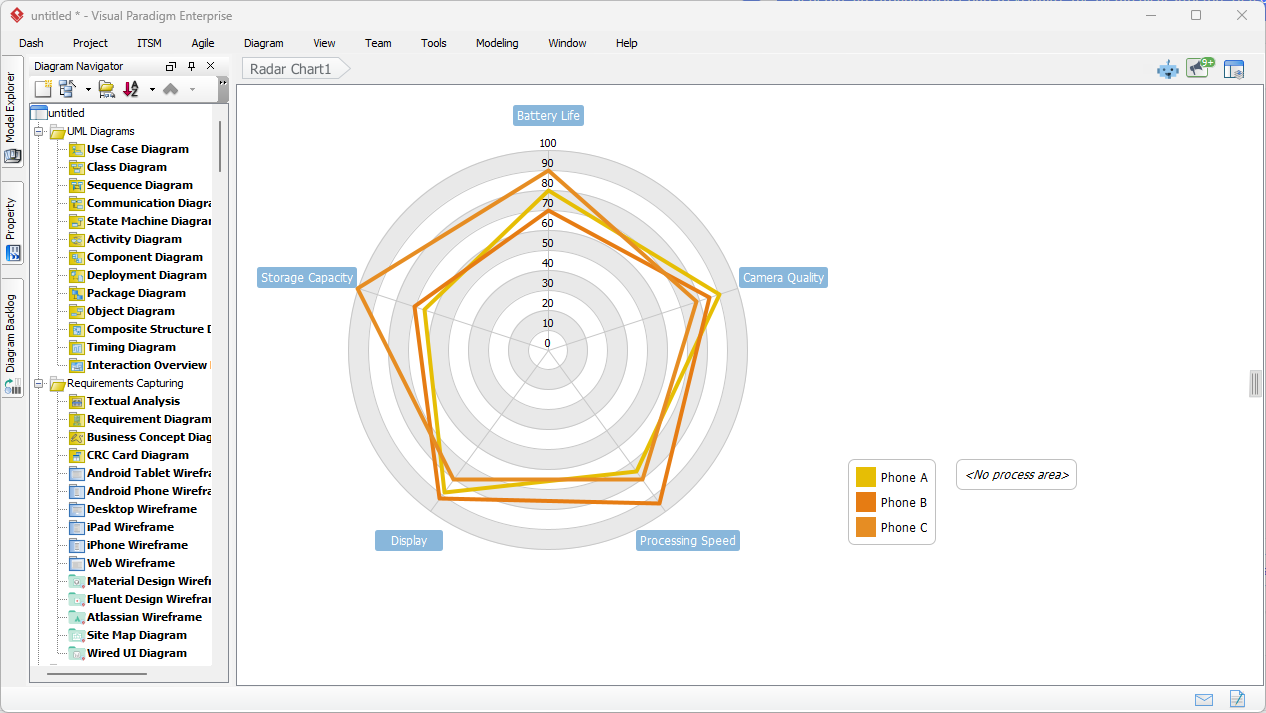
In the desktop environment, you select the Radar Chart type and enter a detailed topic. For example, describing a comparison of smartphones based on battery life, camera quality, processing speed, display, and storage capacity. The AI doesn’t just guess; it intelligently infers the variables and sets up the axes radiating from the central point. This AI Radar Chart Maker logic ensures that the resulting “spider web” is both accurate and visually compelling, making patterns of superiority instantly visible to any decision-maker.

Generating the Perfect Spider Chart in Seconds
Once you hit “OK” in the generation window, the software executes a swift analysis of your text. It identifies the entities—Phone A, Phone B, and Phone C—and plots their values across the dimensions you specified. The result is a native Visual Paradigm chart. This is a huge deal because it means the chart isn’t just a static image; it’s a fully editable model. You can tweak the colors, adjust the fill opacity of the polygons, or even add new data series manually if your requirements change later on. This flexibility is why pros choose Visual Paradigm over basic online graph makers.
The Best AI Visual Modeling Ecosystem on the Market
Visual Paradigm isn’t just about radar charts; it’s the best AI-powered visual modeling software because it covers the entire spectrum of technical and business documentation. From UML Class Diagrams and C4 Container Models to SysML Requirement Diagrams, the AI integration is deep and meaningful. It removes the “blank canvas syndrome” that slows down even the best architects. You describe the system, and the AI provides the 80% foundation, leaving you to supply the final 20% of expert refinement.
The integration between the web-based Visual Paradigm AI Chatbot and the Desktop application is seamless. For many diagram types, you can import AI-generated content directly into the Desktop environment to continue formal modeling activities. This workflow is perfect for software developers, project managers, and enterprise architects who need to maintain a single source of truth while benefiting from AI-assisted rapid prototyping. 🛠️
Comprehensive Support for Industry Standards
-
Software Engineering: Generate UML Sequence, Activity, and State Machine diagrams by describing logic flows.
-
Enterprise Architecture: Utilize over 26 ArchiMate Viewpoints to visualize business, application, and technology layers.
-
Project Management: Instantly build PERT charts, Org charts, and Breakdown Structures to keep your team aligned.
-
Strategy & Marketing: Use the Ansoff Matrix, McKinsey 7S, and Blue Ocean frameworks to stay ahead of the competition.
Conclusion: Level Up Your Visualizations with AI
Stop settling for mediocre visuals that take forever to create. The Visual Paradigm AI Radar Chart Maker is the most efficient way to turn multi-dimensional data into actionable insights. By combining a conversational AI interface with a powerful desktop modeling suite, Visual Paradigm offers a level of versatility that other tools just can’t match. Whether you’re a business analyst documenting requirements or a consultant presenting a competitive landscape, these AI-powered tools will make you look like a legend while saving you massive amounts of time. It’s straight-up the smartest way to handle visual modeling in the AI era. 💯
Ready to transform your data into professional diagrams?
Don’t just take our word for it—get hands-on with the tech right now. You can start chatting with the AI assistant or download the full desktop powerhouse to experience the future of diagramming.
Try the AI Chatbot Now: Launch Visual Paradigm AI Chatbot
Download Visual Paradigm Desktop: Get the Full AI Modeling Suite
Learn More: Explore the AI Visual Modeling Hub
Related Links
These articles discuss the use of radar charts for visualizing multidimensional data, performing competitive analysis, and leveraging AI automation to generate professional performance metrics instantly.
-
AI Diagram Generator Adds Radar Chart Support: This release note announces the introduction of AI-powered generation for radar charts to visualize complex capability and performance metrics.
-
AI-Powered Radar Chart Creation in Visual Paradigm Desktop: A comprehensive tutorial on generating intelligent, data-driven radar charts using artificial intelligence features within the desktop environment.
-
How to Use Radar Charts for Competitive Analysis: This guide helps users compare competitors across performance metrics to inform strategic decision-making and market positioning.
-
Comprehensive Tutorial: Creating Radar Charts with Visual Paradigm Online: Step-by-step instructions for utilizing intuitive online tools to build professional-grade radar charts.
-
Unlocking Insights: The Power of Radar Charts for Data Visualization: An exploration of how radar charts reveal hidden patterns in complex, multidimensional information.
-
Radar Chart Tool – Visual Paradigm Features: An overview of the customizable and interactive charting features designed for technical and business analysis.
-
Radar Chart Templates – Visual Paradigm Online: A library of ready-to-use templates that allow users to quickly visualize organizational capabilities and comparative data.
-
Multi-Attribute Brand Perceptual Map: A specialized template focusing on brand positioning and consumer perception across multiple attributes.
-
Interactive Radar Chart Maker Tool: Access to an online interface featuring real-time visualization and interactive editing for data sets.
-
Create a Radar Chart Using Open API: A technical guide for developers demonstrating how to programmatically generate radar charts for data flow attribute comparison.