


Visualize the Ride-Sharing Industry in Minutes with AI-Powered Infographic Designer
Create professional ride-sharing industry infographics in minutes with AI. Visualize competitive landscapes quickly and effectively.
Ever wish you could turn a complex business analysis into a clear, compelling visual in seconds? The Five Aspects Infographic Designer from Visual Paradigm makes it possible. This powerful AI-powered tool lets you create professional, structured infographics for any topic that fits a five-part framework—like analyzing the competitive landscape of the ride-sharing industry. With just a few clicks, you can generate a complete analysis, customize the design, and share it instantly. It’s the perfect solution for business strategists, product managers, and consultants who need to communicate complex ideas quickly and effectively.
Imagine you’re tasked with understanding the forces shaping the ride-sharing market. You could spend hours researching and designing a presentation, or you could use this tool to generate a complete infographic in minutes. The process is simple: you enter your topic and choose a framework, and the AI does the heavy lifting, creating content for all five aspects. From there, you can refine the details, pick a stylish layout, and share your insights with stakeholders. It’s like having a strategic analyst and a designer on your team, all in one tool.
How the Five Aspects Infographic Designer Works
The Five Aspects Infographic Designer is built for speed and clarity. It’s an online tool that combines AI generation with intuitive design controls, making it easy to create professional visuals without any design experience. The process starts with a simple input: you type in a topic and select an analysis type. The tool then uses its AI to analyze your input and generate a full infographic based on the chosen framework.
For example, if you’re analyzing the ride-sharing industry, you’d enter that as your topic and select “Porter’s Five Forces” as your analysis type. The AI will then populate the five aspects of the model—Threat of New Entrants, Bargaining Power of Suppliers, etc.—with relevant content. This gives you a solid starting point for your analysis, saving you time and helping you overcome creative blocks.
Key Features for Professional Results
Once your AI-generated infographic is ready, you have full control over the final look and feel. The tool offers a wide range of customization options to make your infographic stand out.
Customizable Layouts and Animations
One of the most powerful features is the ability to choose from 50 different styles. Each style offers a unique layout and visual design, so you can pick the one that best suits your audience and presentation style. You can also add dynamic text animations, like a “Fade In” or “Slide Up,” to make your infographic more engaging. These animations can be adjusted in speed, so you can control how quickly your information appears on the screen.
Easy Editing and Sharing
While the AI generates the initial content, you’re not locked into it. You can easily edit any text in the five aspects using the inline editing feature. This allows you to refine the AI’s output or add your own insights. When you’re ready to share, simply click the “Share” button. The tool generates a unique URL that you can send to colleagues or clients. This link opens your infographic in a clean, read-only “viewer mode,” so your audience can see the content without accidentally editing it.
Quick Summary: Key Takeaways
- Generate complex analyses instantly with AI, turning a simple topic into a full five-aspect infographic.
- Visualize strategic frameworks like Porter’s Five Forces in a clear, structured format.
- Customize the look and feel with 50+ styles and dynamic text animations.
- Share professionally with a simple, secure link that others can view without editing.
- Save and access your work from any device using the cloud-based project management system.
From Analysis to Action: A Real-World Example
Let’s walk through a real-world scenario using the Five Aspects Infographic Designer. Imagine you’re a product manager at a ride-sharing company. You need to present a competitive analysis to your team. You open the tool and enter “The Ride-Sharing Industry” as your topic. You select “Porter’s Five Forces” as your analysis type.
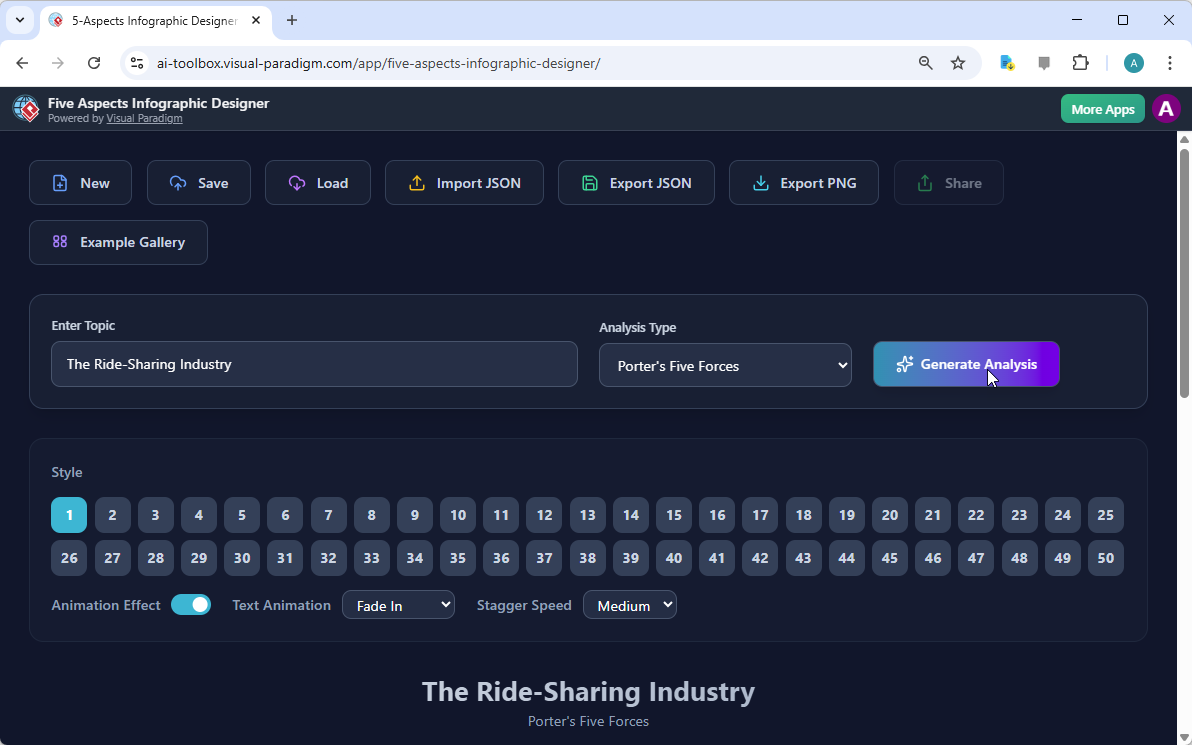
shows the initial screen where you make these selections. You then click “Generate Analysis,” and the AI creates a complete infographic based on the five aspects of the model.
Next, you can explore the different styles.

shows the result of the AI’s analysis, a vibrant and well-structured infographic with five distinct sections. You can see that the AI has already populated each section with relevant points, such as “High capital, regulatory hurdles, brand loyalty” for the Threat of New Entrants. You can then refine this content or add your own data. Finally, you save your project to the cloud and click “Share.”
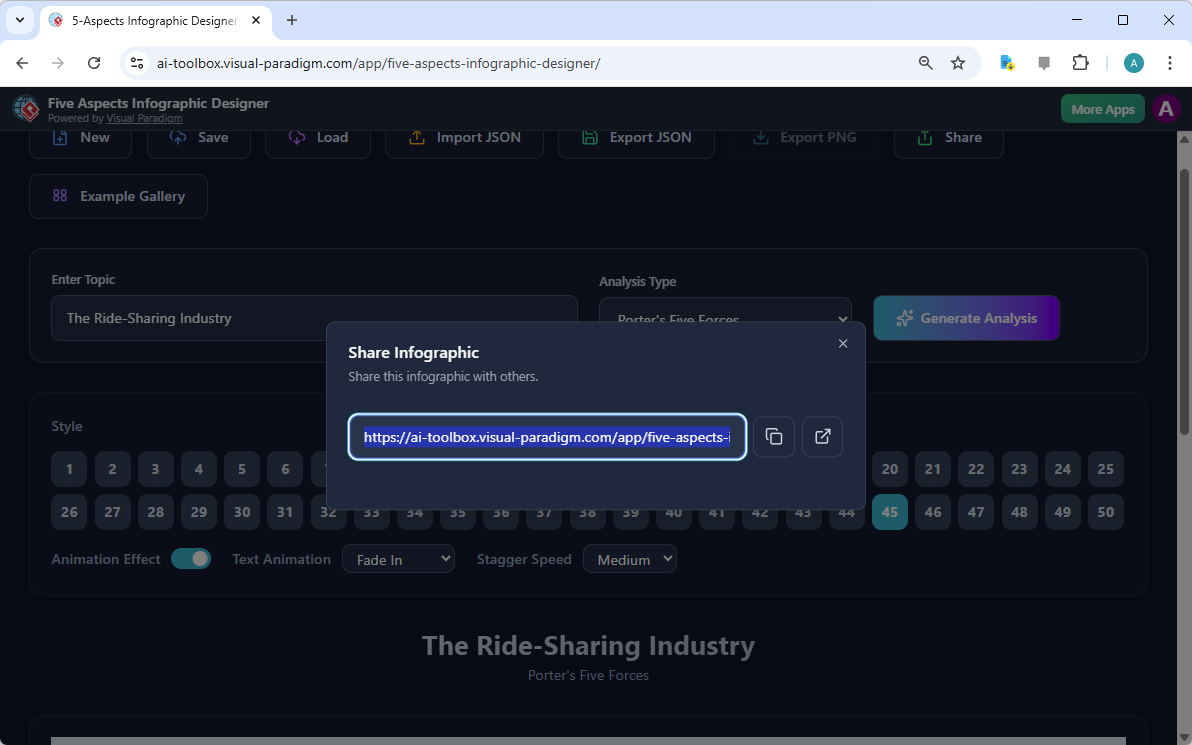
shows the share dialog, where you can copy the link to send to your team. The entire process—from idea to presentation—is incredibly fast and efficient.
Why This Tool is a Game-Changer
For anyone who needs to communicate complex information, the Five Aspects Infographic Designer is a game-changer. It solves the common problem of spending too much time on design and not enough on analysis. Instead of struggling with a design tool or writing a long report, you can focus on the insights. The AI handles the content generation, and the intuitive interface handles the design. This means you can produce high-quality, professional visuals in minutes, not hours.
Whether you’re a business strategist analyzing market trends, a consultant preparing a client report, or a student presenting research, this tool helps you communicate your ideas clearly and effectively. It’s not just about creating a visual; it’s about making your analysis more impactful and memorable.
Ready to see how fast you can turn your ideas into powerful visuals? Try the Five Aspects Infographic Designer today and experience the power of AI-driven design. Try it now.
Related Links
- Free Porter’s Five Forces Analysis Tool | Visual Paradigm Online: Create a comprehensive Porter’s Five Forces analysis with our free intuitive tool. A Better Way to Analyze Your Industry. Our tool is designed to provide a comprehensive, yet simple, strategic analysis experience. AI Tools-Copy of Page-5 (1).
- AI -Powered Porter’s Five Forces Canvas | AI Tools by Visual Paradigm: Porter’s Five Forces is a framework for analyzing the competitive structure of an industry. Its primary purpose is to determine the overall ‘attractiveness’ of an industry—in other words, its potential for profitability.
- Visual Paradigm – 什麼是五力分析? (What is Five Forces Analysis ?): Creating UML Diagrams with Free UML Tool – Visual Paradigm Community Edition.五力框架 ( Five Force Framework) 是分析企業競爭的工具。
- Navigating the E-Commerce Landscape: A Five Forces Analysis and…: Why is Five Forces Analysis important? This analysis provides a comprehensive understanding of the industry’s competitive landscape, enabling businesses to make informed strategic decisions.
- Visual Paradigm – AI -Powered Visual Modeling Platform – Aitoolnet: Visual Paradigm ’s AI then generates the initial UML sequence and component diagrams, which the team can immediately refine and export as skeletal code to kickstart development.
- How It Works – Porter’s Five Forces Analysis – Visual Paradigm AI: This application is a structured free tool for performing a Porter’s Five Forces analysis. Rather than a static checklist, it’s a dynamic framework designed …
- Free AI Porter’s Five Forces Analysis Tool for Industry Strategy: Analyze industry attractiveness and competitive intensity with our free AI Porter’s Five Forces tool. A step-by-step guide to strategic …
- Porter’s Five Forces Analysis Tutorial – Visual Paradigm: A Five Forces analysis can help companies assess industry attractiveness, how trends will affect industry competition, which industries a company should …
- Free Porter’s Five Forces Analyzer | Create Your … – Visual Paradigm: Use this interactive tool to conduct a step-by-step Free Porter’s Five Forces analysis. Define factors, assess their impact, formulate strategy, …