


Organize Your Weekly Meals: Mastering Data with the AI Table Generator
Learn how to use the Visual Paradigm AI Table Generator to organize weekly meals and generate HTML, Markdown, or SQL tables instantly without any coding required.
Let’s be real for a second: nobody—and I mean nobody—wakes up in the morning excited to hand-code an HTML table. It’s tedious, those <tr> and <td> tags are a nightmare to keep straight, and if you miss one closing tag, your whole page layout explodes. But whether you are a developer needing sample data, a technical writer wrestling with Markdown, or just someone trying to organize their life, tables are a necessary evil.
Enter the AI Table Generator by Visual Paradigm. This isn’t just a spreadsheet; it’s a bridge between your messy ideas and perfectly structured code. Imagine simply typing “Give me a weekly meal plan with calories” and watching a fully populated, formatted table appear before your eyes. That is exactly what we are looking at today. We’re going to dive into how this online AI tool transforms a mundane task like planning dinner into a seamless, tech-savvy workflow.
Quick Summary: Why You’ll Love This Tool
- Zero Coding Required: Generate complex HTML, Markdown, or SQL tables just by describing what you want in plain English.
- Instant Format Switching: See your data as a visual grid and instantly preview it as code (JSON, CSV, HTML, etc.).
- Familiar Interface: The interactive grid editor feels just like Excel or Google Sheets, so there is no learning curve.
- Time-Saving AI: Populate massive datasets (like dummy data for testing) in seconds rather than hours.
- Cloud Convenience: Save, share, and access your tables from anywhere via the cloud.
From Dinner Plans to Clean Code: A Visual Breakdown
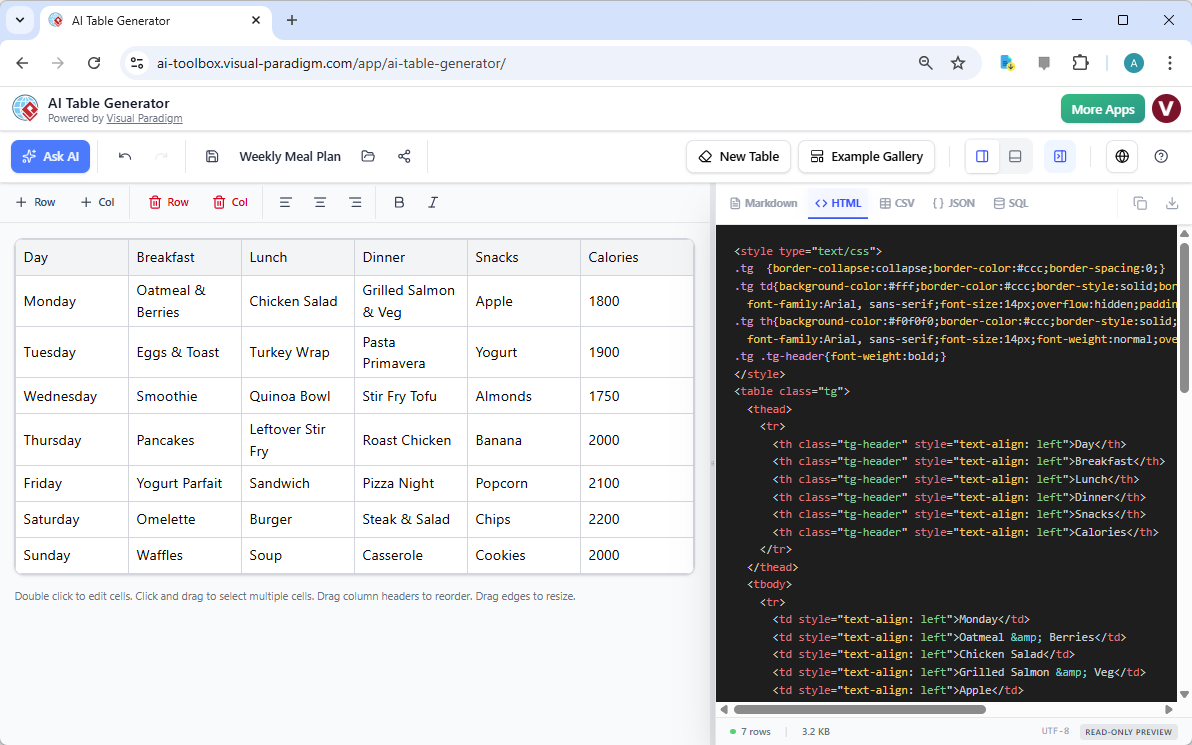
Let’s look at a concrete example to see how this magic happens. In the screenshot below, we are looking at a classic “Weekly Meal Plan.” On the left side of the screen, you have a user-friendly, visual grid. It looks approachable, right? You’ve got columns for the Day, Breakfast, Lunch, Dinner, Snacks, and even a Calorie count. It’s clean, readable, and easy to edit. If you wanted to swap “Oatmeal” for “Pancakes” on Monday, you’d just click and type.
But the real superpower is on the right side of the split screen. While you are messing around with your salad options, the AI Table Generator is silently writing the code for you in real-time. In this specific view, it’s generating the CSS styling and the HTML structure needed to put this table on a website. You don’t have to worry about border-collapse or cell padding; the tool handles the heavy lifting.
How the Magic Happens: Features That Save Your Sanity
So, how do we get from a blank screen to that beautiful meal plan? The tool combines three massive features into one slick interface. It’s like having a data entry clerk, a designer, and a developer all sitting inside your browser.
1. The “Generate with AI” Feature
This is the “fun teacher” part of the tool. Instead of manually typing out “Monday, Tuesday, Wednesday…” and filling in every single cell, you simply click the “Generate with AI” button. You pop open a dialog box and type a prompt like: “Create a 7-day meal plan with columns for each meal and a calorie count, focusing on healthy proteins.”
Boom. The AI understands context. It doesn’t just give you blank rows; it fills them with logical data (like putting “Omelette” for breakfast and not “Steak”). This is incredibly useful for developers who need SQL sample data or business analysts creating quick mockups.
2. The Multi-Format Live Preview
This is where the Visual Paradigm AI Table Generator really flexes its muscles. Look at the right panel in our example image. Currently, it’s showing HTML, complete with embedded CSS styles. But with a single click on those tabs above the code, you can switch the output to:
- Markdown: Perfect for technical documentation on GitHub or distinct Wiki software.
- CSV/JSON: Essential for data analysts and developers moving data between apps.
- SQL: It will literally write the
INSERT INTOstatements for you to populate a database.
It removes the guesswork. You don’t have to “hope” your Markdown syntax is correct; you can see it rendered live.
3. The Interactive Grid Editor
Sometimes AI gets it 90% right, but you need that final 10% of human touch. The left side of the screen is your interactive grid editor. It works exactly how you expect a spreadsheet to work. You can add rows, delete columns, bold text, and align content using the toolbar at the top. It’s tactile and responsive. If the AI suggests “Cookies” for Sunday dinner (we wish!), you can manually change it to “Casserole” in seconds.
Who is This Tool Actually For?
You might be thinking, “I’m not a web developer, do I need this?” or “I’m a hard-core coder, is this too simple?” The answer is yes, and no (in that order). This online table maker hits a sweet spot for a variety of users.
For the Developers and Data Nerds
If you are building a database, you know the pain of creating dummy data. You usually have to write a script or manually type out 50 rows of INSERT statements. With this tool, you ask the AI for “50 rows of user data with names, emails, and random IP addresses,” switch the view to SQL, and copy-paste. You just saved yourself an hour of boring work.
For Writers and Content Creators
Markdown is great, but creating tables in Markdown is visually confusing. Lining up those pipes | and dashes --- is a headache. With this tool, you build the table visually, and then just copy the perfectly formatted Markdown code into your document. It ensures your documentation looks professional without the syntax struggle.
For the “Organizers” (Like our Meal Planner)
Even if you never look at the code, the tool is a fantastic way to structure thoughts. You can create comparison charts, feature lists, or study schedules using the AI to brainstorm for you. Once you’re done, you can save it to the cloud or share a read-only link with your partner so they know what’s for dinner.
Getting Started: A 3-Step Workflow
Ready to try it? Here is the cheat sheet to getting your first table live:
- Ask the AI: Open the tool and hit “Generate with AI.” Be specific! “A comparison table of the top 5 smartphone brands with specs.”
- Refine the Data: Use the grid editor to tweak the facts. Maybe you want to highlight the “Price” column or bold the winning brand.
- Export Your Code: Look at the preview panel. Need it for your blog? Select HTML. Need it for a report? Select CSV. Click “Copy” and you are done.
Conclusion
Whether you are mapping out a weekly meal plan or populating a massive SQL database for a new app, the struggle with structured data is real. Visual Paradigm’s AI Table Generator takes the friction out of the process. It combines the ease of a spreadsheet with the power of a code generator, all wrapped up in a smart, AI-driven package.
Stop fighting with table tags and start letting the AI do the heavy lifting for you. It’s time to make your data work as hard as you do.
Ready to generate your first table in seconds? Click here to try the AI Table Generator for free right now!
Related Resources
- AI Table Generator – Visual Paradigm: A tool that uses artificial intelligence to generate structured tables from input data or descriptions, enhancing data modeling and documentation workflows.
- AI Table Generator – ai-toolbox.visual-paradigm.com: Trial includes full access to table creation and editing, but premium features such as save, load, share, export and AI generation will be disabled.