


Clothing Brand Growth: Strategy Mapping with the AI KPI Performance Diagram Builder
Optimize your clothing brand's growth with AI-powered KPI mapping. Create visual strategic roadmaps and link initiatives to performance metrics effortlessly.
In the high-stakes world of modern e-commerce, achieving sustainable growth requires more than just a great product line; it demands a surgical level of strategic clarity. The AI-powered KPI Performance Diagram Builder by Visual Paradigm is a revolutionary tool designed to transform abstract business goals into vivid, actionable visual roadmaps. By leveraging the power of artificial intelligence, this professional performance dashboard creator eliminates the daunting “blank canvas” problem, allowing leaders to generate comprehensive performance frameworks from a single descriptive prompt. Whether you are navigating the complexities of a clothing brand’s seasonal launch or optimizing a global supply chain, this platform serves as the ultimate interactive command center for your strategic initiatives.
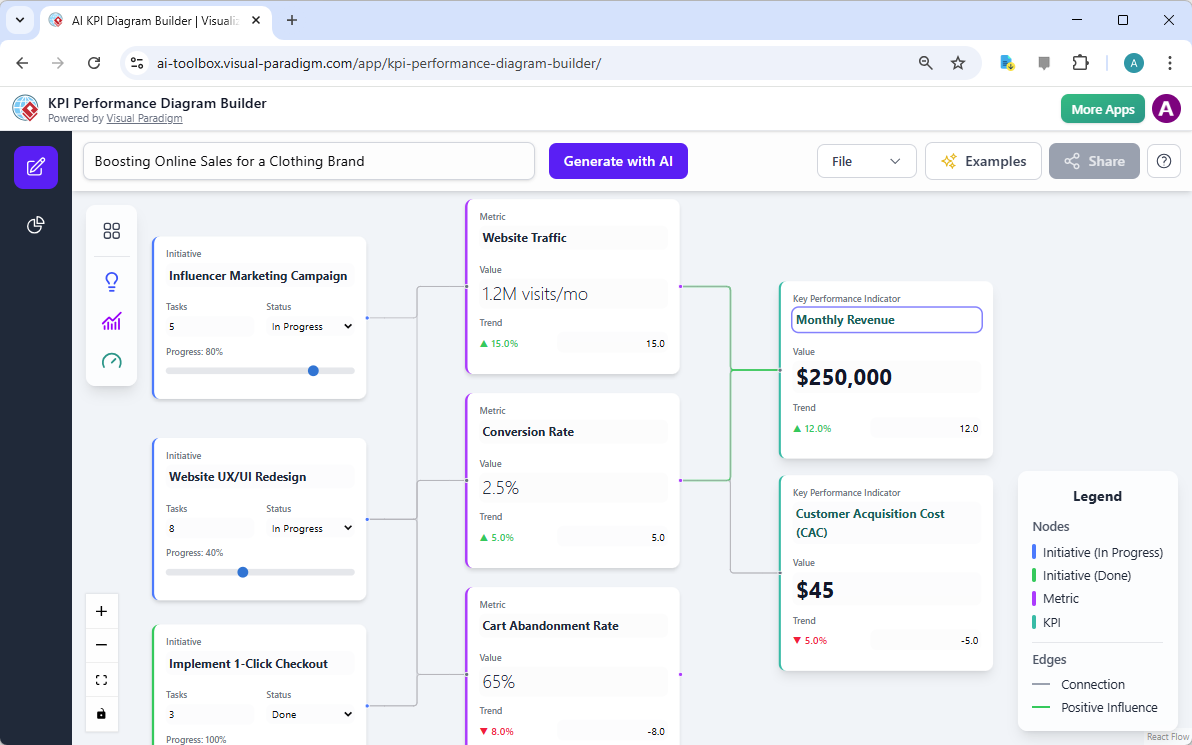
The interface of this innovative application is designed for both power and simplicity, utilizing a React Flow-powered canvas that makes diagramming feel fluid and intuitive. In a typical scenario, such as boosting online sales for a fashion retailer, the tool automatically populates the workspace with essential nodes. You can see how high-level strategic efforts, like influencer marketing and website redesigns, are directly linked to the metrics that track their success. This visual hierarchy ensures that every team member understands not just what they are doing, but exactly how their work influences the company’s bottom line.
Key Takeaways for Strategic Excellence
- Instant Framework Generation: Use AI to automatically build complex diagrams of Initiatives, Metrics, and KPIs based on your specific business domain.
- Visual Strategic Alignment: Clearly map the relationship between operational tasks and high-level business objectives to foster organizational accountability.
- Data-Driven AI Insights: Generate instant reports, including executive summaries, risk assessments, and performance analyses, based on your diagram data.
- Seamless Collaboration: Save your projects to the cloud and share interactive, read-only versions of your strategy with stakeholders via a simple URL.
- Professional Documentation: Export high-resolution PNG images or JSON files for presentations, reports, and long-term project management.
Mastering the Architecture of Success: Initiatives, Metrics, and KPIs
To truly excel in performance management, one must understand the distinct roles of the elements within the professional strategy mapper. At the foundational level, we have Initiatives. These are the specific projects or tasks your team undertakes, such as “Implementing a 1-Click Checkout” or “Launching a Website UX/UI Redesign.” The builder allows you to track the progress and status of these initiatives directly on the node, providing an immediate visual cue of project health. When an initiative is marked as “In Progress” or “Done,” the entire team can see the momentum of the strategic plan in real-time.
Flowing from these initiatives are Metrics. These are the quantifiable measures that tell you if your actions are producing the desired effect. For a clothing brand, these might include “Website Traffic,” “Conversion Rate,” or “Cart Abandonment Rate.” The AI-powered KPI Performance Diagram Builder is particularly intelligent here, as it can suggest relevant metrics for any specific initiative you select. This ensures that you are never flying blind and that every project has a corresponding data point to validate its impact. By connecting these metrics to your initiatives with “Positive Influence” edges, you create a logical flow that justifies every dollar of your budget.
Finally, everything culminates in Key Performance Indicators (KPIs). These are the crown jewels of your strategy—the high-level outcomes that define business success. In our clothing brand example, “Monthly Revenue” and “Customer Acquisition Cost (CAC)” represent the ultimate health of the organization. The beauty of using this easy-to-use KPI maker is the ability to see how a single initiative, like a marketing campaign, ripples through various metrics to finally move the needle on a major KPI. This level of visibility is indispensable for business strategists who need to make informed decisions about where to pivot or double down on their efforts.
Transforming Diagrams into Actionable Intelligence
Beyond the visual mapping, the true power of this platform lies in its AI-driven strategic insights. Once your diagram is established, you can engage a suite of analytical tools that act as a digital consultancy. The “Executive Summary” feature distills your entire visual map into a concise, professional narrative perfect for boardroom presentations. If you are concerned about potential roadblocks, the “Risk Analysis” tool examines the connections and statuses within your diagram to identify vulnerabilities in your performance ecosystem, allowing you to develop mitigation strategies before a crisis occurs.
For those who need to dive deeper into specific team efforts, the “Team Performance Report” provides a granular look at how individual initiatives are performing in relation to their assigned metrics. This best online KPI tool doesn’t just show you what is happening; it explains the “why” behind the data. By analyzing trends—such as a 15% increase in website traffic alongside a 5% drop in cart abandonment—the AI provides recommendations on how to further optimize these connections for even greater returns. This turns a static diagram into a living, breathing document of business intelligence.
Sharing Your Vision with the World
In any professional setting, strategy is only as effective as the communication behind it. The AI-powered KPI Performance Diagram Builder recognizes this necessity by providing robust cloud management and sharing features. Once you have perfected your performance framework, saving it to the secure cloud ensures it is accessible from any device, anywhere in the world. This flexibility is vital for remote teams and traveling executives who need to stay connected to their strategic goals. The application also provides an “Auto-Layout” feature, ensuring that your diagram remains clean, organized, and professional, regardless of how many nodes you add.
When it comes time to present your findings to clients or colleagues, the sharing functionality is remarkably efficient. By generating a unique, shareable URL, you can invite others to view an interactive, read-only version of your diagram. This allows stakeholders to explore the connections and data points themselves without the risk of accidental edits to the original project. It is a powerful way to build consensus and ensure that everyone—from the marketing department to the C-suite—is literally on the same page regarding the company’s performance trajectory.
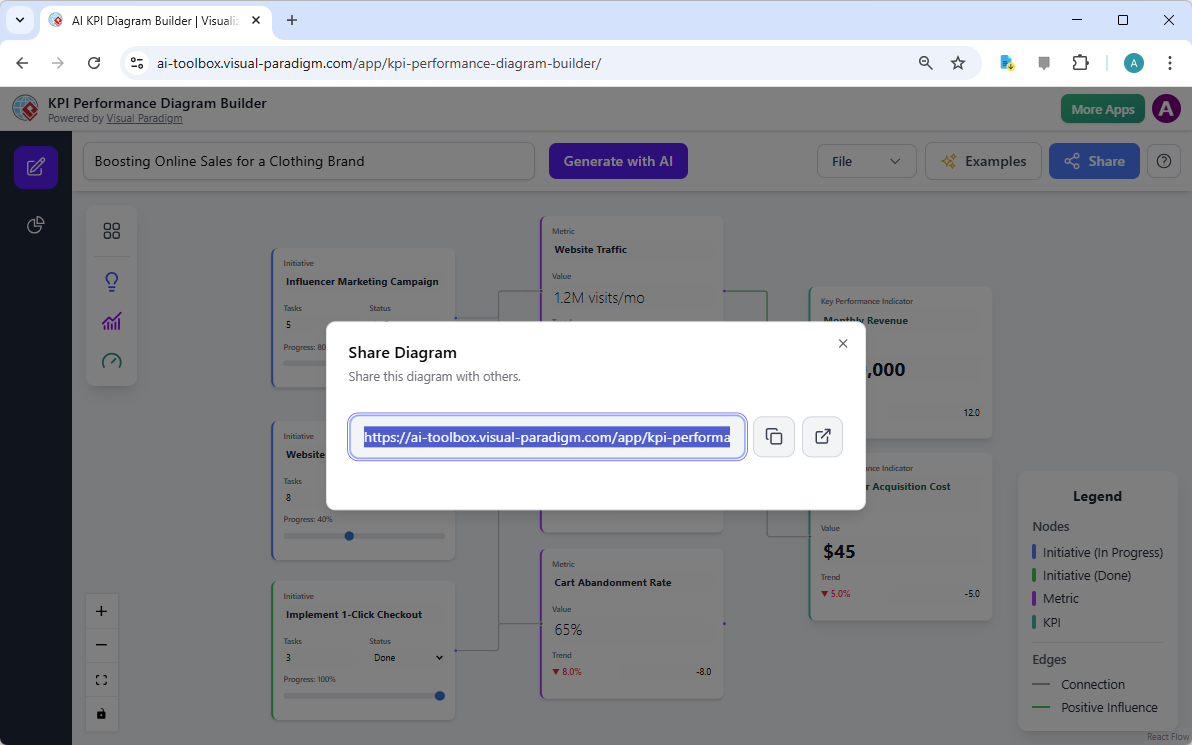
The sharing interface is designed to be as frictionless as possible, offering a direct link that can be copied with a single click. This feature is particularly useful for consultants who need to provide regular updates to clients or project managers who want to keep their teams aligned during weekly stand-ups. By providing a transparent, visual, and easily accessible version of the truth, the professional performance dashboard creator fosters an environment of trust and shared purpose, which are the cornerstones of any high-performing organization.
Conclusion: Elevate Your Strategic Performance Today
In conclusion, the AI-powered KPI Performance Diagram Builder is much more than a simple drawing tool; it is a comprehensive engine for strategic growth. By combining the speed of AI generation with the flexibility of a professional diagramming canvas, it empowers business leaders to visualize, analyze, and communicate their performance frameworks with unprecedented clarity. From defining the first initiative to sharing the final success story via a cloud link, every step of the strategic process is enhanced by the tool’s intelligent features. Do not let your business goals remain trapped in spreadsheets and text documents—bring them to life and drive your organization toward its full potential.
Are you ready to experience the future of strategic planning? Start mapping your success today and see how easy it is to align your team, track your metrics, and hit your KPIs with precision. Visit the links below to launch the builder and transform your business vision into a visual reality.
Experience the Tool: Try the AI KPI Performance Diagram Builder Now
Learn More: Explore the Full Features of Visual Paradigm’s Strategic Tools
Related Links
- AI KPI Performance Diagram Builder | Visualize Your Strategy: Use our AI-powered tool to create and visualize KPI Performance Diagrams. Map the relationship between strategic initiatives, metrics, and key business goals for clarity and data-driven insights.
- AI-Powered KPI Performance Diagram Builder – Visual Paradigm AI: Generate executive summaries, performance breakdowns, strategic recommendations, and risk analyses. Turn your diagram into a powerful analytical report with a single click. …
- AI KPI Diagram Builder | Visualize & Analyze Business Performance with AI: Map out initiatives, metrics, and KPIs with AI. Build dynamic diagrams, uncover insights, and generate executive summaries that drive smarter strategic …
- AI KPI Diagram Generation Tool – Visual Paradigm Product Updates: Effortlessly generate, visualize, and analyze your business strategy with Visual Paradigm’s new AI KPI Performance Diagram Builder.
- Intelligent BPM and Analysis Suite | AI Process Mapping Tool – Visual Paradigm: Visual Paradigm’s AI-powered suite helps document, visualize, and analyze business processes with stakeholder diagrams and reports effectively.
- KPI Mapping | Project Process Map Template: Eye-catching Project Process Map template: KPI Mapping. Great starting point for your next campaign. Its designer-crafted, professionally designed and helps you stand out.
- KPI Mapping Template: Fully customizable KPI mapping template that helps you define your own KPI mapping. Try Visual Paradigm Online’s visual process map designer. Sign up today. Try it free.